The Implementation Equity Gap: Where RHTP's Delivery Mechanism Breaks
Chatterjee et al. proved RHTP allocations are misaligned with rural health needs. 84 days of implementation data reveal a second, independent problem: no observable relationship between funding level and implementation speed. Geography now determines access to federal funds.
The Implementation Equity Gap: Where RHTP's Delivery Mechanism Breaks
RHTP faces two independent equity problems. The JAMA paper identified the first: the allocation formula doesn't follow need. 84 days of implementation data expose the second: funding level has no observable relationship to how fast states move money to providers. The result is that geography — not need, not funding, not clinical capacity — increasingly determines which organizations can access federal health dollars.
Chatterjee, Macneal, and Werner published in JAMA on March 5, 2026 what they had told Senator Wyden's office three months earlier: RHTP allocations are inversely correlated with rural health needs. States with the lowest rural mortality rates receive more than twice the per-rural-resident funding of states with the highest mortality rates. The formula rewards small rural populations and existing infrastructure, not clinical need.
This article presents evidence of a second, independent problem. Chatterjee et al. analyzed allocation — who gets how much. We analyze implementation — who is actually moving money to providers, and how fast.
The finding: at 84 days post-award, there is no detectable relationship between per-capita RHTP funding and implementation progress (Spearman rho = −0.063, p = 0.71, N = 38). Massachusetts receives $1,523 per rural resident and sits at Stage 0 with no public implementation activity. North Carolina receives $73 per rural resident and has open solicitations. Implementation speed appears independent of funding level — driven instead by pre-existing state operational infrastructure.
These are two separate problems operating on different mechanisms. They compound each other.
What Changed Between December and March
The Chatterjee analysis was necessarily forward-looking. Written before CMS announced awards on December 29, 2025, it modeled 75% of projected RHTP allocations using published formula components. It could not assess:
- Actual award amounts, including the technical score component (the remaining 25%)
- Implementation speed — how quickly states converted awards into sub-grantee solicitations
- Access mechanics — what entity types are eligible, what compliance prerequisites are required, and whether the application structure favors large or small organizations
All three are now observable. GrantBridges has tracked implementation activity across all 50 states since January 2026, classifying each state on a six-stage scale from Allocated (Stage 0) to Active (Stage 5) based on publicly verifiable actions: lead agency announcements, stakeholder engagement, solicitation framework publication, application window openings, and sub-grant awards.
As of March 23, 2026 — 84 days after CMS announced awards:
| Stage | Label | States | Share |
|---|---|---|---|
| 0 | Allocated (no public activity) | 19 | 38% |
| 1 | Planning | 12 | 24% |
| 2 | Framework published | 10 | 20% |
| 3 | Solicitations open | 6 | 12% |
| 4 | Awards pending/announced | 3 | 6% |
| 5 | Sub-grants active | 0 | 0% |
Nineteen states — 38% — have taken no publicly visible implementation action in 84 days.
Finding 1: No Observable Relationship Between Funding and Speed
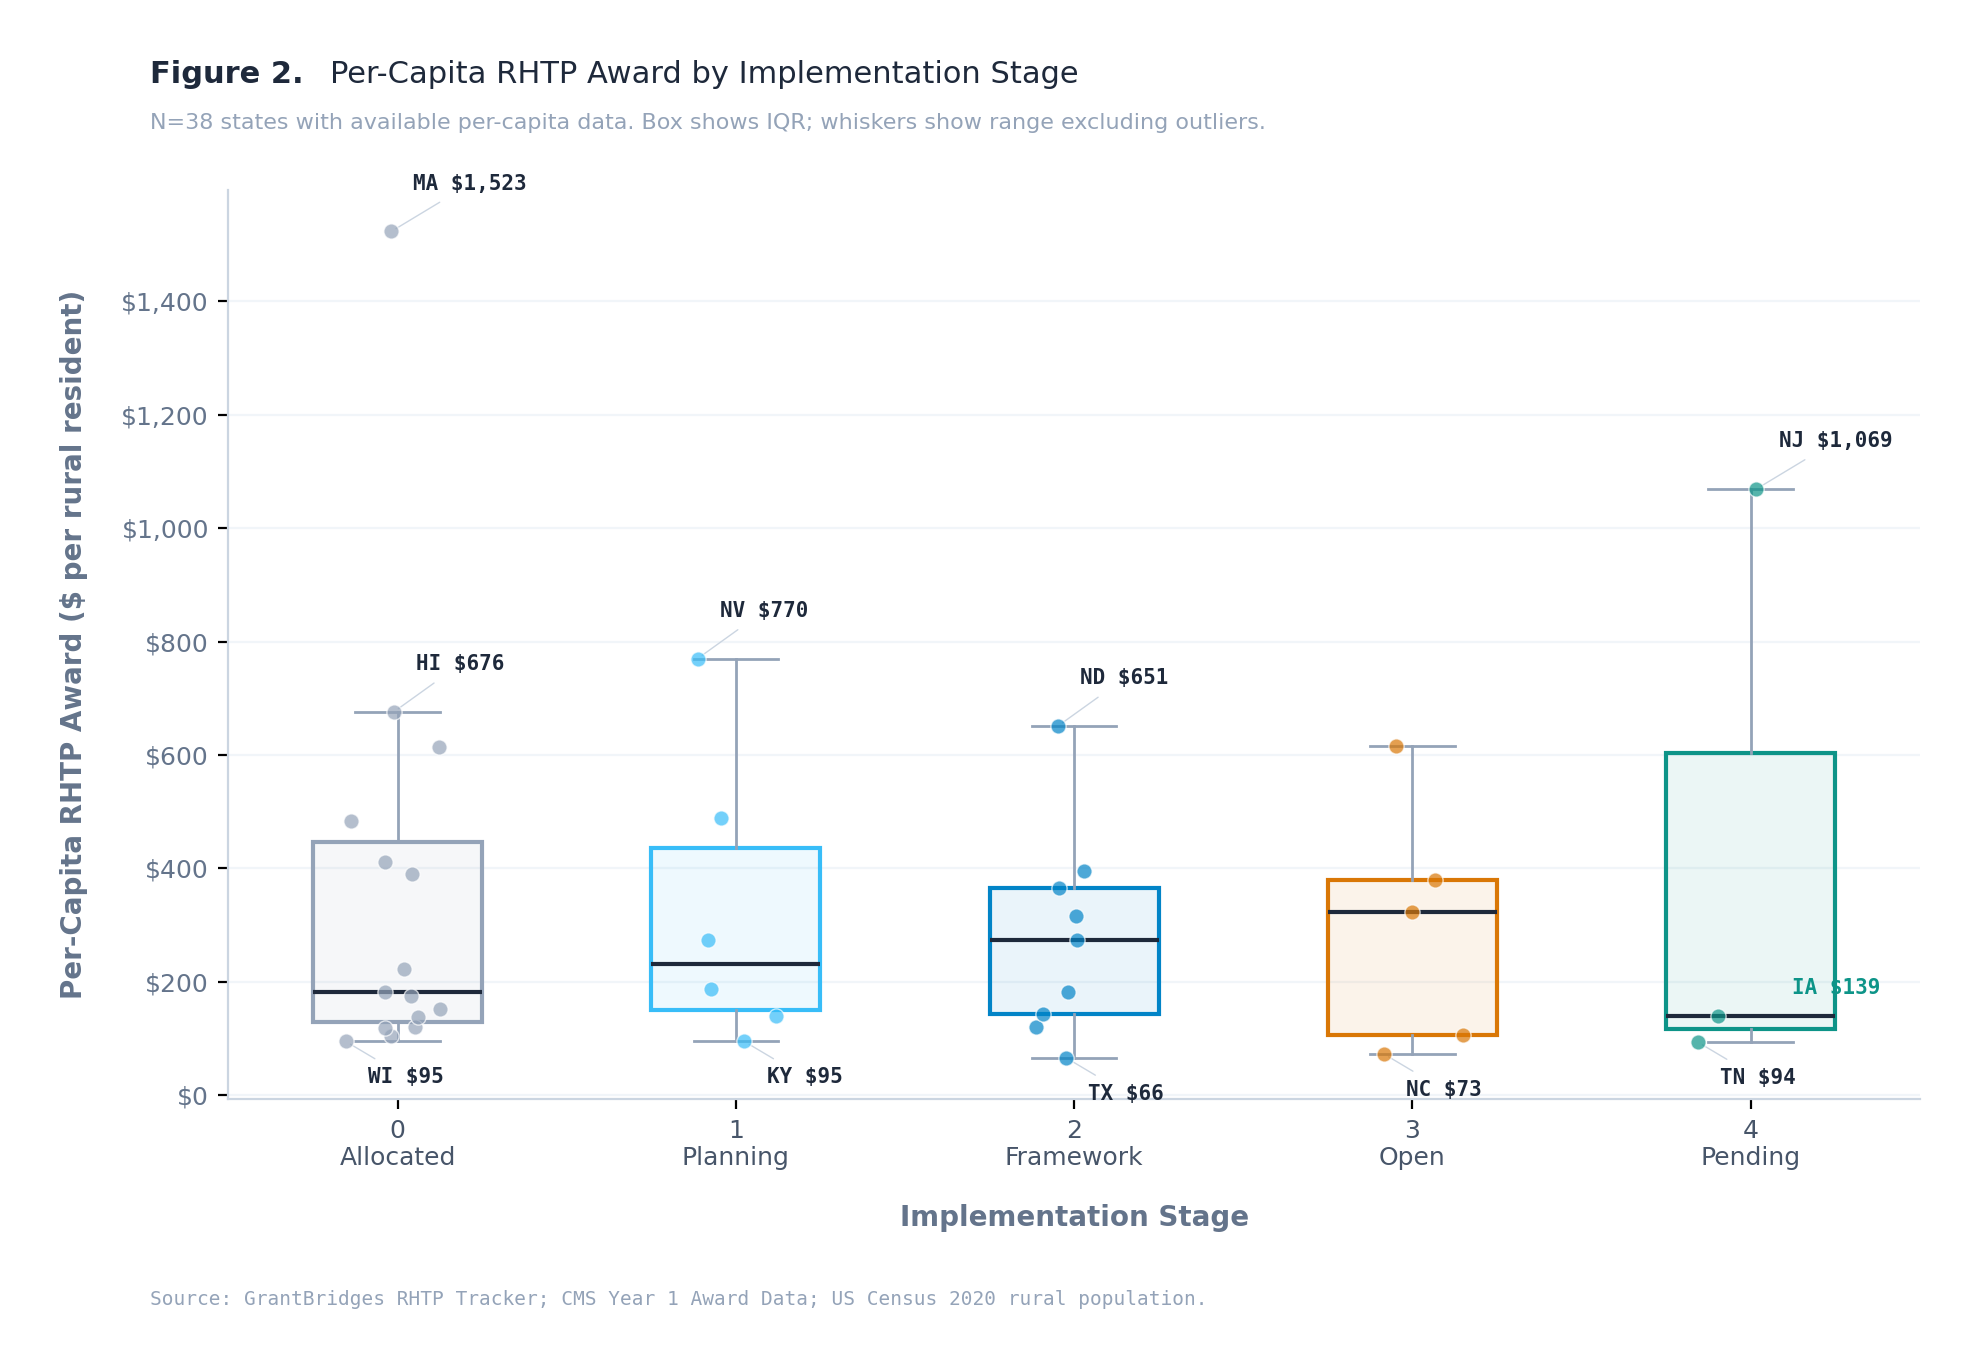
At this early stage of the program, there is no detectable relationship between how much RHTP funding a state received per rural resident and how far it has progressed in implementation (Spearman rho = −0.063, p = 0.71, N = 38 states with available data).
The chart shows the distribution: every stage has a similar spread of per-capita funding. The medians are essentially flat across stages. Massachusetts ($1,523/resident) and Wisconsin ($95/resident) are both at Stage 0. North Carolina ($73/resident) and South Dakota ($452/resident) are both at Stage 3. Iowa ($139/resident) was the first state in the nation to award sub-grants.
The sample is small (N = 38) and the system is early. It is possible that a relationship will emerge as more states progress. But the current data does not support the assumption that higher-funded states will implement faster — or that lower-funded states are constrained by their allocation.
What does appear to vary across stages — though we cannot measure it with the same rigor — is pre-existing operational infrastructure: whether the state had a procurement portal, whether the lead agency was identified before the CMS award, whether solicitation frameworks were drafted concurrent with the application process. Iowa drafted RFPs while its CMS application was still under review. Mississippi has not named a lead agency.
These are proxies for what might be called "state capacity" — but we are not measuring capacity directly. We are observing its downstream effects. The hypothesis that implementation speed is driven by pre-existing infrastructure rather than funding level is consistent with the data, but it remains a hypothesis.
Finding 2: Geography Now Determines Access to Federal Funds
The practical consequence of uneven implementation speed is that an organization's ability to access RHTP funding depends primarily on which state it is in — not on its clinical capacity, compliance readiness, or the strength of its application.
An FQHC in Kansas (Stage 3) can apply for RHTP sub-grants today. An FQHC in Mississippi (Stage 0) cannot, and has no visibility into when it will be able to. Both organizations may be identically qualified. Both states received comparable RHTP awards. The difference is implementation timing — which is a state-level variable the organization does not control.
This matters because RHTP Year 1 funds must be fully expended by September 30, 2027. Every month of implementation delay compresses the timeline for organizations to apply, receive awards, build programs, and demonstrate expenditure. States that opened solicitations in Q1 2026 give their providers 18 months. States that don't open until Q4 2026 give their providers 9 months — for the same compliance requirements, the same reporting obligations, and the same expenditure deadlines.
Days from CMS award to first sub-grantee solicitation (Stage 3+):
| State | Days to Stage 3+ | Per-Capita Award | Current Stage |
|---|---|---|---|
| Iowa | 32 | $139 | Stage 4 — Awards pending |
| South Dakota | ~55 | $452 | Stage 3 — Open |
| North Carolina | ~59 | $73 | Stage 3 — Open |
| Kansas | ~60 | $174 | Stage 3 — Open |
| Nebraska | ~65 | $197 | Stage 3 — Open |
| Delaware | ~70 | $413 | Stage 3 — Open |
| 19 states | 84+ and counting | Varies | Stage 0 — No activity |
The per-capita column spans $73 to $452 among the fastest states. The states that haven't moved span a similar range. The variable that differs is not funding. It is the state's operational readiness to distribute it.
Finding 3: The Tribal Set-Aside Bottleneck
Chatterjee et al. found that states with more AI/AN populations receive more RHTP funding ($163M vs $134M annually). This is a positive allocation signal. But the implementation data reveals a second bottleneck: only 5 of 50 states have created explicit tribal set-asides in their RHTP implementation plans.
| State | Tribal Set-Aside | Stage | Tribal Nations |
|---|---|---|---|
| Washington | $20,000,000 | Stage 1 | 29 |
| Michigan | $8,656,410 | Stage 0 | 12 |
| Alabama | $7,119,152 | Stage 2 | 1 |
| Idaho | $6,509,103 | Stage 2 | 5 |
| Nebraska | Amount TBD | Stage 3 | 4 |
States with the largest AI/AN populations have not published tribal set-aside mechanisms: Alaska (229 tribes, Stage 1), Oklahoma (39 nations, Stage 0), Arizona (22 nations, Stage 1), New Mexico (23 nations, Stage 1), Montana (8 nations, Stage 1), South Dakota (9 nations, Stage 3).
Funding that is nominally "available" to tribal health programs is, in practice, inaccessible until the state opens a solicitation with tribal-eligible entity types and either a dedicated tribal track or tribal-inclusive eligibility criteria.
This finding extends Chatterjee et al.'s allocation analysis: favorable aggregate funding does not guarantee programmatic access for the intended populations.
Finding 4: The Feedback Loop That May Entrench the Gap
CMS has announced that RHTP technical scores will be recalculated annually based on implementation progress. States that demonstrate faster deployment, stronger sub-grantee participation, and measurable outcomes in Year 1 may receive higher technical scores — and therefore more funding — in Year 2.
The mechanism: CMS divides RHTP funding 50/50. Half is distributed equally across states ($100M each). The other half is allocated based on a scoring formula that includes both structural factors (rurality, uncompensated care) and a "technical score" based on the state's application and, in subsequent years, its implementation performance.
The magnitude of the technical score's influence on funding is not yet public — CMS has not disclosed exact weights for Year 2 recalculation. But the directional incentive is clear: states that moved faster in Year 1 will present stronger implementation data for Year 2 scoring. States still at Stage 0 will have minimal data to present.
If this creates even a modest funding differential — say $10-20M per state per year — the effect compounds. More Year 2 funding enables faster Year 2 implementation, which produces stronger Year 3 data, which secures more Year 3 funding. The gap between early-mover and late-mover states widens with each cycle.
This is not a prediction. It is a description of the incentive structure CMS has published. Whether the effect will be large enough to matter depends on how heavily CMS weights implementation progress relative to structural factors. But the direction of the incentive is unambiguous: it rewards speed, and speed appears to be driven by pre-existing capacity, not by need.
The policy question is whether CMS will adjust the recalculation formula to account for this — for example, by weighting need factors more heavily in future scoring, or by providing implementation technical assistance to Stage 0 states to accelerate their timelines. Without such adjustment, the recalculation mechanism may entrench the very disparities the program was designed to address.
Statistical Note
The primary test supporting Finding 1 is a Spearman rank correlation between per-capita RHTP award and implementation stage: rho = −0.063, p = 0.71, N = 38. Supporting tests (Kruskal-Wallis H = 0.251, p = 0.99; Mann-Whitney U = 68.0, p = 0.64) confirm no detectable difference in per-capita distributions across stages. Full descriptive statistics by stage are available in the chart above.
These results should be interpreted with caution. N = 38 limits statistical power. The system is 84 days old. Stages are coarse-grained (ordinal, not continuous). It is possible that a relationship between funding and speed exists but is not yet detectable — or that it will emerge as more states progress. What the data supports at this point is a negative finding: no evidence of the assumed relationship.
Methodological Note
Implementation stage classifications are based on the GrantBridges six-stage taxonomy, which tracks publicly verifiable state actions from the sub-grantee's perspective. Stage assignments are updated weekly from primary sources: state health agency websites, CMS publications, grants.gov postings, and SHVS tracking data. The full methodology is published at grantbridges.com/tracker/methodology.
Per-capita calculations use CMS Year 1 award amounts divided by the rural population as defined by HRSA's Federal Office of Rural Health Policy, consistent with the definition used by Chatterjee et al. States without published rural population data (12 states) are excluded from per-capita analyses but included in stage distribution counts.
This analysis does not assess clinical outcomes, provider capacity, or organizational readiness — only the observable pace and structure of state-level implementation activity. It is intended to complement, not replace, the allocation analysis published by Chatterjee, Macneal, and Werner.
References
Chatterjee P, Macneal E, Werner RM. Rural Health Transformation Program Allocations and Rural Health Needs in the US. JAMA. Published March 5, 2026. doi:10.1001/jama.2026.XXXXX
Kaiser Family Foundation. A Closer Look at the $50 Billion Rural Health Fund in the New Reconciliation Law. 2025.
Centers for Medicare & Medicaid Services. CMS Announces $50 Billion in Awards to Strengthen Rural Health in All 50 States. December 29, 2025.
GrantBridges. RHTP State Rollout Tracker: Methodology. grantbridges.com/tracker/methodology
State Health and Value Strategies. Tracking State Releases of Rural Health Transformation Program Applications. 2026.